 |
DirectorySmart
4.7 with
|
||||||||||||||||||||||||||||||||||||||||||||||||||||||||||||||||||||||||||||||||||||||||||||||||||||||||||||||||||||||||||||||||||||||||||||||||||||||||||||||||||||||||||||||||||||||||||||||||||||||||||||||||||||||||||
Contents
DisclosureCompaq, Microsoft, and OpenNetwork Technologies sponsored the testing in this report. Mindcraft, Inc. conducted the performance tests described in this report at OpenNetwork Technologies in Clearwater, Florida. |
Mindcraft's tests show that DirectorySmart with Active Directory provides enterprise-class performance. Our test results include:
Performance is an important consideration when evaluating which product to buy. However, performance comes at at cost. So, in this paper we present not only performance measurements but also normalized performance metrics based on the total cost of ownership for each solution tested. The Test Methodology section describes how we tested the performance of DirectorySmart with Active Directory and explains the Extranet and Login performance metrics. Total Cost of OwnershipTotal Cost of Ownership (TCO) represents the costs to acquire, install, maintain, and use a solution. TCO includes the following costs:
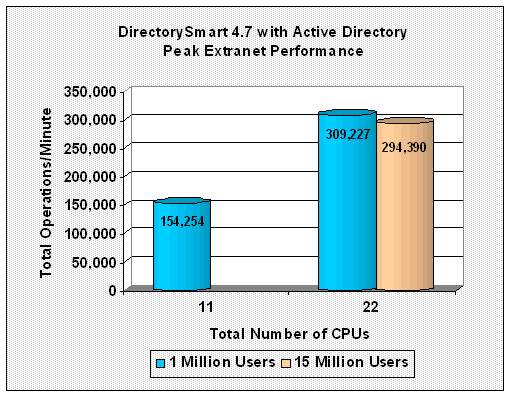
In this paper, we evaluate TCO for a three-year period. Also, we use two metrics to help you compare these results to others and to make purchasing decisions and project justifications: TCO/Performance and Annual TCO/User. TCO/Performance is a price/performance metric that is useful for comparing performance results of different solutions because it normalizes performance based on the cost to own the solution. A lower TCO/Performance metric is better than a higher one because the solution with the lower metric costs you less per unit of performance than one with a higher metric. Annual TCO/User is simply the annualized TCO (TCO divided by three) divided by the number of users in the directory. Using Annual TCO/User metrics based on the same number of users, you can make informed purchasing decisions and Extranet project justifications. Annual TCO/User should be used only with solutions that meet your performance requirements. A lower Annual TCO/User metric means that the solution costs you less per user each year than one with a higher metric. So a smaller Annual TCO/User is better. There is a caveat to using the Annual TCO/User metric: it is affected significantly by the number of users in the directory being tested. Therefore, when comparing Annual TCO/User metrics be sure that they were based on the same number of users. The TCO spreadsheet for these tests shows how we arrived at the TCO and calculates the TCO/Performance and Annual TCO/User metrics. We have set up the TCO spreadsheet so that you can enter your own costs and even evaluate the TCO/Performance and Annual TCO/User for other solutions. Detailed Extranet ResultsThe Extranet Scenario simulates customers or suppliers logging into a private Web site and obtaining information they are authorized to get. It measures the combination of one user authentication and 10 authorizations for access to resources (these 11 operations constitute one Extranet sequence). We report the total operations per minute. The Extranet Scenario, because it uses a more realistic mix of operations than the Login Scenario, provides a better basis for comparing access control and identity management solutions. You can find a more complete description of the Extranet Scenario below. All of the TCO-oriented Extranet tests were done with the DirectorySmart cache configured as if the servers were situated in a network DMZ. In this "Normal" cache configuration policies and user status information are cached but user access rights and passwords are not cached. We did an additional Extranet test with the DirectorySmart cache configured as it could be if the servers were on the inside of a private network. See Full-Cache Results for more details. Figure 1 shows the Extranet Scenario performance of DirectorySmart 4.7 with Active Directory for tests with 1,000,000-user and 15,000,000-user directories. The X-axis shows the total number of CPUs used in all of the servers. We did not test a six-CPU configuration with a 15,000,000-user directory. Figure 1: DirectorySmart 4.7 with Active Directory Extranet Performance
Table 1 shows the Extranet Scenario performance and TCO metrics. The per CPU performance is the highest we've measured to date by almost 20%. Table 1 shows performance with a 1,000,000-user directory scaled linearly as the number of CPUs doubled. The corresponding TCO/Performance improved by over 42% with the additional CPUs. Also, the Annual TCO/User for the configuration with more CPUs was reduced by over 15%. Table 1 shows the Extranet Scenario performance and TCO metrics. The per CPU performance is the highest we've measured to date by almost 20%. The 1,000,000-user directory test results show:
Table 1: DirectorySmart 4.7 with Active
Directory
The performance of the 15,000,000-user directory test is notable because Active Directory had to access disk for each user authentication, whereas all of the user authentication data was cached in memory for the 1,000,000-user directory tests. Table 2 shows the CPU utilizations for the Active Directory and Web servers during the Extranet tests. During all of these tests the load generator systems had CPU utilizations between 30% and 35%. The reason that the server CPU utilizations were so close for all of the Extranet tests is that available network bandwidth between the Web servers and the load generators severely limited performance. For each authorization, which makes up 10 out of every 11 Extranet operations, a 14,000-byte file is transferred from a Web server to a load generator. This means that even for the lowest performance test, Test #1, each network segment used 87.2 Mbits/second just for sending the file data. Unfortunately, we were not able to measure directly the network bandwidth used. However, assuming a total network overhead of 10%, the effective bandwidth used was 96 Mbits/second out of a possible 100 Mbits/second. Adding the bandwidth needed for each authentication, it is clear that the network was saturated. Obviously, if more network bandwidth were available between the Web servers and the load generators, performance would have been significantly higher. Table 2: DirectorySmart 4.7 with Active Directory Extranet CPU Utilization
Detailed Login ResultsThe Login Scenario simulates users requesting and receiving the first Web page at a protected Web site. It measures the combination of one user authentication and one authorization for access to a protected resource (called a Login). We report Logins/minute. The Login Scenario assumes that 10% of the user population in a directory logs in concurrently to use resources. So, for the tests with a 1,000,000-user directory, 100,000 users did a Login. For the test with a 15,000,000-user directory, 1,500,000 users did a Login. Login Scenario performance results should be considered best-case performance. See the Login Scenario for more details on the test. All of the TCO-oriented Login tests were done using DirectorySmart's
normal cache configuration, just like
the Extranet tests. We did an additional Login test using DirectorySmart's
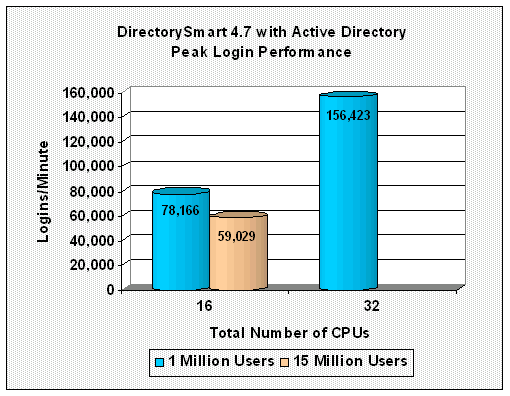
full-cache configuration. Figure 2 shows the Login Scenario performance of DirectorySmart 4.7 with Active Directory for tests with 1,000,000-user and 15,000,000-user directories. The X-axis shows the total number of CPUs used in all of the servers. We did not test a 32-CPU configuration with a 15,000,000-user directory. Figure 2: DirectorySmart 4.7 with Active Directory Extranet Performance
Table 3 presents the Login Scenario performance and TCO metrics. For this scenario, the 1,000,000-user directory tests show:
Table 3: DirectorySmart 4.7 with Active
Directory
For this scenario too, the performance of the 15,000,000-user directory test was impacted because Active Directory had to access disk for each user authentication. The CPU utilizations for the Login Scenario test are shown in Table 4. For Tests #4 and #6, the load generator CPUs were 95% utilized. During Test #5, the load generator CPU utilization was 65%. Because each Login does an authorization, there is a 14,000-byte file is transferred from a Web server to a load generator. So, Tests #4 and #6 used about 73 Mbits/second of the bandwidth between each load generator system and Web server. Because each network segment was in full-duplex mode, this bandwidth usage level was not enough to limit performance. For Tests #4 and #6, the 95% CPU utilization on the load generators did contribute to limiting overall performance. The amount of disk activity on the directory servers was a performance-limiting factor also. The lower CPU utilization in Test #5, which used a RAID to store the directory for 15,000,000 users, is the result of heavy disk activity to get the login credentials for each user. Table 4: DirectorySmart 4.7 with Active Directory Login CPU Utilization
Detailed Full-Cache ResultsThe tests reported in this section were done with the DirectorySmart cache configured as it could be if the servers were on the inside of a private network. This means that DirectorySmart was configured to cache configuration policies, user status information, user access rights, and passwords. Table 5 presents the Extranet and Login Scenario performance using Active Directory and DirectorySmart's full-cache configuration. The Extranet performance is the highest we've measured to date. Additionally, the Extranet operations/minute/CPU is more than double that of any solution we have tested. With Active Directory, DirectorySmart's full-cache Login performance also exceeds that of any product we have tested by 36%. In addition, its Login operations/minute/CPU is more than 2.6 times that of any other product. Table 5: DirectorySmart 4.7 with Active
Directory
In Table 6, you can easily see the benefit of using the full-caching capabilities of DirectorySmart: the CPU utilization for the Active Directory server is 0% for both the Extranet and Login Scenario tests, Tests #7 and #8, respectively. During the Extranet Test #8, the load generator systems had 75% CPU utilizations. As with the other Extranet tests, the performance-limiting factor was the network bandwidth between the Web servers and the clients. Extranet performance would have been significantly higher if more network bandwidth were available between the Web servers and the load generators. The Login performance was limited by the load generator systems, which ran at 100% CPU utilization. Table 6: DirectorySmart 4.7 with Active
Directory
ConclusionsThe results lead us to conclude that:
Test MethodologyMindcraft® tested the performance of DirectorySmart 4.7 with Active Directory using our iLOAD MVP™ tool to run the AuthMark™ Benchmark Login and Extranet Scenarios. In this section, we describe these tools so that you will be able to understand our performance measurements. iLOAD MVP OverviewiLOAD MVP is a general-purpose, script-driven capacity planning, benchmarking, and regression testing tool. The major components of iLOAD MVP are:
iLOAD MVP provides the capabilities needed to test high-performance servers with a small number of load generator systems. Its capabilities include:
The AuthMark BenchmarkThe AuthMark Benchmark is designed to test the performance of products that provide authentication and authorization services in support of Web servers. Authentication is the process of verifying who a user is; it typically occurs when a user logs in. Authorization is the process of verifying that an authenticated user is allowed to see or to use a particular resource. In the case of a Web server such resources include HTML files, graphic files, and programs that generate Web pages dynamically. AuthMark simulates a large number of users accessing Web servers via their browsers. This approach permits AuthMark to test authentication and authorization performance independent of the technology used to provide those services. AuthMark consists of several test scenarios to determine various aspects of performance for authentication and authorization systems under different circumstances. For the DirectorySmart with Active Directory tests we used the AuthMark Login and Extranet Scenarios. AuthMark Login ScenarioThe AuthMark Login Scenario focuses on testing authentication. It simulates users requesting and receiving the first Web page at a protected Web site. The Login Scenario measures the combination of one user authentication and one authorization for access to a protected resource (called a Login). We report Logins/minute. Understanding what happens during a login will help you understand what the Login Scenario measurements mean. Login ProcessThe following simplified sequence will walk you through the login process to show you how it works using the DirectorySmart login process (which differs from the HTTP 1.0 and 1.1 protocols in that a form is used to send the user name and password):
Once it has been authenticated, the iLOAD load generator automatically sends the encrypted session cookie in each header whenever it requests a URL in the same realm, just like a Web browser does. Login Scenario ConfigurationTable 7 shows the AuthMark Login Scenario configuration parameters we used. Table 7:
AuthMark Login Scenario Configuration Parameters
Running the Login ScenarioThe basic steps for running the Login Scenario are:
The Login Scenario test script selects users randomly from the user database (see Table 7 for the numbers we used for these tests). The tester is free to select the number of load generator systems and the number of iLOAD MVP load generator threads to use. The tester selects the number of load generators to get the highest performance possible from the authentication/authorization system being tested. In order to obtain the peak performance from an authentication/authorization system, the tester may need to use multiple Web servers and directory servers. The tester is permitted, but not required, to do a warm-up run of the test scenario in order to get the servers to a state that would more likely represent the state they would be in during normal operation. For this benchmark, we warmed-up the servers by running the test script in its entirety. Extranet ScenarioThe Extranet Scenario simulates customers or suppliers logging into a private Web site and obtaining information they are authorized to get. It measures the combination of one user authentication and 10 authorizations for access to resources (these 11 Extranet operations constitute one Extranet sequence). We report the total operations per minute. The Extranet Scenario depicts a more complete and more realistic usage pattern than the Login Scenario. The Extranet Scenario test execution starts with the same operation sequence as the Login Scenario (steps 1 - 5 above) and continues with the following operations:
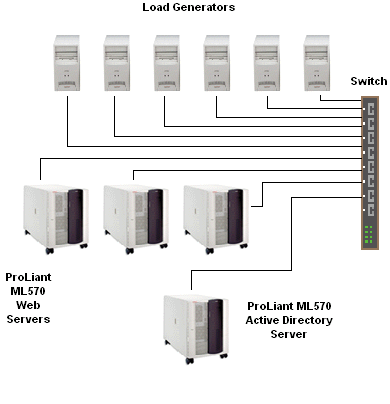
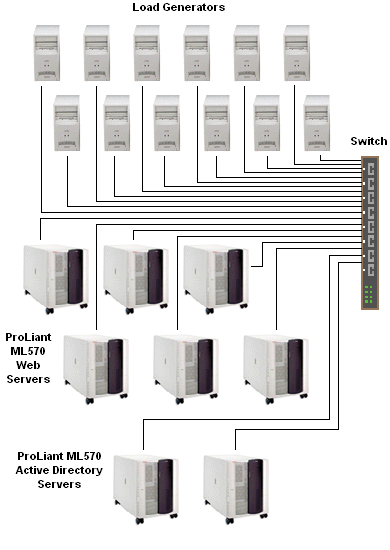
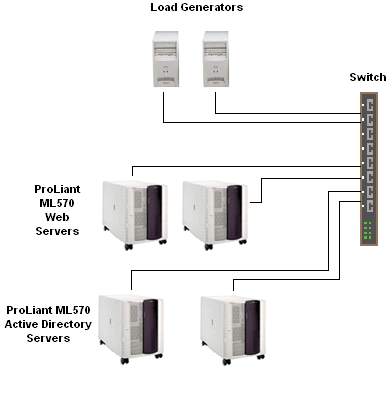
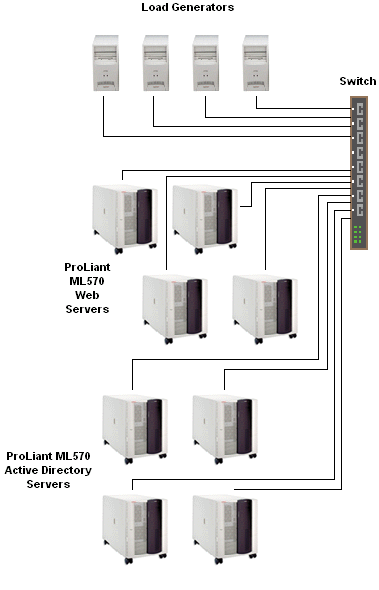
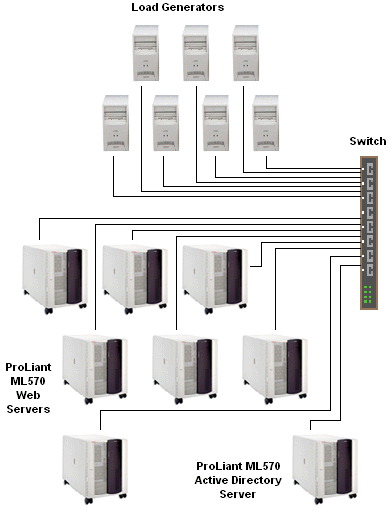
DirectorySmart checks the continued validity of the authenticated user each time a resource access request is made to ensure that the user session has not been revoked. However, the user is not re-authenticated. As a result, the user does not see a new login request as long as the resources being accessed are in the Internet domain in which the user has been authenticated. For the Extranet Scenario, we warmed-up the servers by running the test script in its entirety. Hardware Configurations TestedWe used Compaq ProLiant ML570 servers for all tests. Table 8 shows the detailed Compaq ProLiant ML570 configuration. Table 9 shows by test the number of servers and how many CPUs each had. We used a Cisco Catalyst 2900XL switch to network the servers and load generator systems. Table 8: Compaq ProLiant ML570 Servers
Table 9: Server Configurations by Test
Figure 3:
Test #1 - Extranet, 1 Million Users
Figure 4:
Test #2 and #3 - Extranet, 1 Million and 15 Million Users
Figure 5:
Test #4 and #5 - Login, 1 Million and 15 Million Users
Figure 6:
Test #6 - Login, 1 Million Users
Figure 7:
Test #7 and #8 - Full-Cache Extranet and Login, 1 Million Users,
Server Software Configuration and TuningWe used the following software on the Compaq Proliant ML570 servers:
All software ran with default settings except for the following:
User DataUser data was loaded into Active Directory using an LDIF file that was generated using a tool provided by OpenNetwork Technologies. The LDIF file had the following characteristics:
Here is a sample entry in the LDIF file:
Client Test SystemsFor all of the tests, we used personal computers for the load generator systems configured as shown in Table 10. The number of load generator systems we used for each test are shown in Figures 3 through 7. Table 10: PC Load Generator Systems Configuration
NOTICE: The information in this publication is subject to change without notice. MINDCRAFT, INC. SHALL NOT BE LIABLE FOR ERRORS OR OMISSIONS CONTAINED HEREIN, NOR FOR INCIDENTAL OR CONSEQUENTIAL DAMAGES RESULTING FROM THE FURNISHING, PERFORMANCE, OR USE OF THIS MATERIAL. This publication does not constitute an endorsement of the product or products that were tested. This test is not a determination of product quality or correctness, nor does it ensure compliance with any federal, state or local requirements. Mindcraft is a registered trademark of Mindcraft, Inc. Product and corporate names mentioned herein are trademarks and/or registered trademarks of their respective companies. |
||||||||||||||||||||||||||||||||||||||||||||||||||||||||||||||||||||||||||||||||||||||||||||||||||||||||||||||||||||||||||||||||||||||||||||||||||||||||||||||||||||||||||||||||||||||||||||||||||||||||||||||||||||||||||

Mindcraft is a registered trademark of Mindcraft, Inc.
Product and corporate names mentioned herein are trademarks and/or registered trademarks of their respective owners.
For more information, contact us at: info@mindcraft.com
Phone: +1 (408) 395-2404
Fax: +1 (408) 395-6324
