|
|
iPlanet Web Server,
|
||||||||||||||||||||||||||||||||||||||||||||||||||||||||||||||||||||||||||||||||||||||||||||||||||||||||||||||||||||||||||||||||||||||||||||||||||||||||||||||||||||||||||||||||||||||||||||||||||||||||||||||||||||||||||||||||||||||||||||||||||||||||||||||||||||||||||||||||||||||||||||||||
White Paper Contents
|
Test MethodologyThis section of the white paper describes the testing tool we used, WebBench 3.0, and the special test programs we developed to measure the calling efficiency of a server-side programming interface (SPI) that dynamically generates HTML pages (for example, Java servlets or C CGI programs). We use the term server-side programming interface rather than application programming interface (API) to distinguish that the programs we refer to run on the server and not the client. The more generic API term is ambiguous because programs written in Java and JavaScript can run either on a client or on a server. WebBench 3.0WebBench tests the performance of a Web server by making HTTP GET requests to it. WebBench increases the stress on a Web server by increasing the number of client test systems (simply called clients) that request URLs. The number of clients at which peak Web server performance is measured is a function of the performance of each WebBench client, the Web server's performance, and the requests made. Thus, it will take more slow clients than fast clients to make a Web server reach its peak performance. This means that the shape of a curve that plots Web server performance against the number of clients participating in a test mix is not significant before the peak performance point. However, the curve is significant after the peak performance point because it shows how well a Web server handles an overload. WebBench can generate a heavy load on a Web server. To do this in a way
that makes benchmarking economical, each WebBench client sends an
HTTP request to the Web server being tested and waits for the reply.
When it comes, the client immediately makes a new HTTP request. This
way of generating requests means that a few test systems can
simulate the load of hundreds of users. You need to be careful,
however, not to correlate the number of WebBench client test systems
with the number of simultaneous users that a Web server can support
since WebBench does not behave the way users do. WebBench MetricsWebBench produces a standard set of reports as a spreadsheet workbook. The Summary Report provides two metrics as a function of the number of clients participating in a test mix: the number of HTTP GET requests/second a Web server can satisfy and the corresponding throughput measured in bytes sent/second. The peak request rate is a useful measurement for comparing Web servers and SPIs. A larger number of requests/second means that one product can handle a larger load than the alternative. However, the peak request rate is also a function of the average size of a response. For example, a Web server responding only to static requests for files averaging 14 KB might perform at 1,000 requests/second. However, if the average file size requested drops to 500 bytes, that same Web server would respond at a significantly higher rate, perhaps 2,500 requests/second. So when we compare request rates we must be careful to look at the average size of the responses. The throughput measurements in the WebBench Summary Report are useful for determining the average response size at each request rate and for seeing what the peak number of bytes sent across the network is. Because throughput is equal to the number of requests/second times the average response size in bytes, you can easily find the average response size given the request rate. WebBench also provides a detailed Client Data Report showing a great deal of information for each client in each test mix. An important measurement is buried in this report. It is the average latency. Latency is defined as the time from starting a connection to a Web server to send a request until the last byte of the response is received. Latency is especially interesting when comparing the performance of alternative SPIs, which will be discussed below. WebBench Test Scenarios and WorkloadsWebBench comes with several standard tests. Each test is divided into two parts: a workload and a test scenario. Except for the standard static test, Mindcraft either modified a WebBench test or created a new one in order to do the tests for this white paper. The following is a description of each test we ran (we have combined all of the test programs we used in a single tar file and a zip file to make downloading easier):
We used HTTP 1.0 without keepalives for all of our tests, just like the standard WebBench 3.0 tests. SPICE TestsThe programs we developed test Server-side Programming Interface Call Efficiency, or simply SPICE. We developed the concept of SPICE tests:
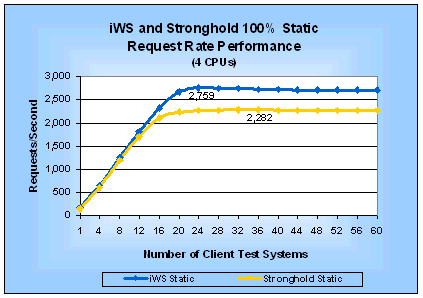
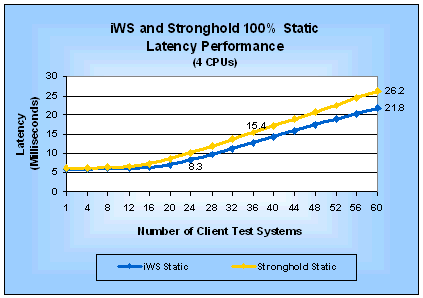
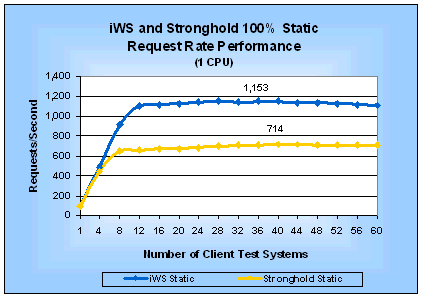
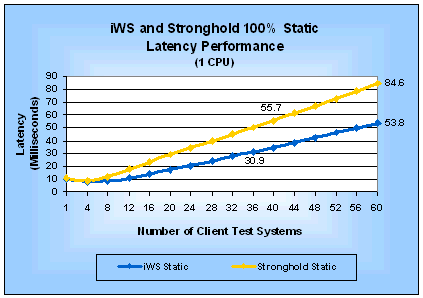
SPICE tests use applications that do the minimum processing needed to return the same average number of bytes as a static test will return. This means that SPICE tests can be used to make fair comparisons between static-only, dynamic-only, and mixed static-dynamic test scenarios because the response rate for the SPICE programs are not artificially inflated because they return less data than static requests. A SPICE test essentially measures the minimum overhead for using a particular SPI. A common alternative to SPICE tests is to simulate a real-world application. One obvious problem with this alternative is that the simulated application will almost certainly behave differently than the one you want to deploy. While that is also true with SPICE programs, they have an advantage over simulated applications because they are simpler to implement, smaller and use fewer resources. This simplicity and size advantage lets you use SPICE programs to evaluate the true overhead of using a SPI as well as making it much easier to develop and run a test. Of course, if you have your own real application available, you are much better off using it to make your comparisons than an SPICE test. SPICE MetricsYou can use almost any Web server performance measurement tool to do SPICE tests as long as it supports executing a program that does the minimum processing necessary to return the same number of bytes as a static test. Of course, if your tool returns a different average number of bytes than WebBench, you will have to modify your SPICE programs to return the correct number of bytes. For SPICE tests, your tool needs to make two types measurements: the number of requests/second the Web server delivers and the average latency for requests. We call these the SPICE request rate and the SPICE latency, respectively. The SPICE request rate is useful for comparing Web server performance under load. It incorporates the performance of the server hardware, the server operating system, the Web server software, and the SPI. It is based on aggregating the performance of all of the requests from all of the client systems used in a test. Comparing Web server performance based on SPICE request rate results in a server-centric comparison. Evaluating Web server and SPI performance solely based on the SPICE request rate can be misleading. The SPICE request rate will always be the upper bound of your server's peak performance, unless your application does almost nothing. You can improve the validity of your evaluation by incorporating SPICE latency. Using SPICE latency to evaluate Web server and SPI performance helps you make decisions from a user perspective. You can think of SPICE latency as answering the question, "How much latency will I experience if I try to use a server with the current load on it?" The answer to this question can affect how responsive a user will find your Web application. By looking at the SPICE latency on each client system, you can see if a Web server is handling client requests unequally and if the clients (your future users) will experience an unacceptably long wait for a response. If either of these undesirable conditions is true, the useful peak performance of the Web server is lower than the peak performance you are measuring. You can determine the useful peak performance by finding the maximum performance point at which the Web server treats client requests equally and at which it has an acceptable SPICE latency. SPICE latency also is useful to estimate the response time a user will experience from a lightly loaded server. Simply add the SPICE latency to the time it takes your application to do its job and your estimate is done. Unfortunately, this simple addition will not be accurate for a heavily loaded server because your real application will take up CPU time, memory and other resources thereby increasing the actual latency. We define SPICE efficiency as the ratio of a SPICE metric to the same static test metric. In other words: SPICE request efficiency = SPICE latency efficiency = SPICE efficiency is a measure of how much dynamic request performance using a particular SPI will degrade from that of static-only requests. As you look at the SPICE efficiency metrics keep in mind that they help you evaluate alternative SPIs for one Web server. If you want to use them in a comparison of different Web servers then you must evaluate SPICE efficiency in the context of the measured SPICE request rate performance of each Web server. Otherwise, you may come to incorrect conclusions. Another way to use the SPICE efficiency ratios is to evaluate them at the peak request rate and at the maximum load (in our case at 60 clients). Doing so, you can gain insight as to how the efficiency of an SPI changes as load on the server increases. AnalysisNow that you have an understanding of our test methodology, let us look at each of the tests results to understand their significance. The following analysis will group tests of comparable features and SPI alternatives together to make it easier to compare them. Static TestsThe WebBench static test makes requests for HTML pages stored in files without any additional processing. Its results represent an upper limit on the performance of a Web server. Figures 1 and 2 give the request rate and latency, respectively, for 100% static requests on a four-processor server. Table 1 summarizes the corresponding peak performance measurements and shows how much faster iWS is than Stronghold for static requests. Similarly, Figures 3 and 4 and Table 2 compare performance for a one-processor server. Table 1: Static Performance (4-CPU Server)
Table 2: Static Performance (1-CPU Server)
We will use the static test results to evaluate the efficiency of each SPI. Figure 1: iWS and Stronghold Static Request Rate
Performance (4 CPUs)
Figure 2: iWS and Stronghold Static Latency
Performance (4 CPUs)
Figure 3: iWS and Stronghold Static Request Rate
Performance (1 CPU)
Figure 4: iWS and Stronghold Static Latency
Performance (1 CPU)
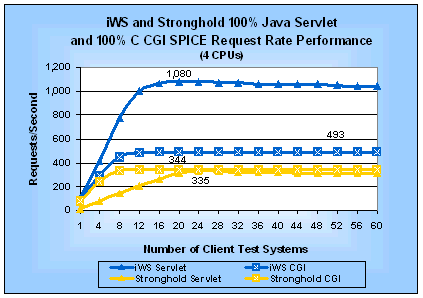
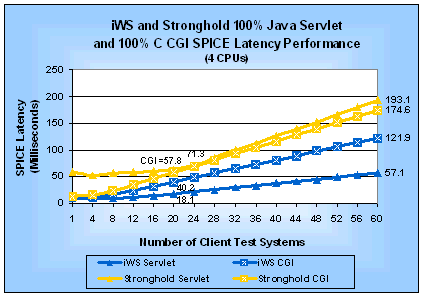
Java Servlet and C CGI TestsWe used the Java servlet support provided in iWS and the Java 2 SDK. Stronghold does not include a Java servlet SPI so we used Apache JServ for it because Stronghold is based on Apache. We elected to do our CGI SPICE test with a program written in C so that we could have the fastest possible CGI program. This approach let us test the overhead in using a CGI program without including other overheads such as that needed to start a Perl program. Four-Processor ResultsFigures 5 and 6 show the SPICE request rate and SPICE latency performance we measured on a four-processor server for tests using 100% Java servlet and 100% CGI requests. Table 3 summarizes the corresponding peak performance measurements on a four-processor server as well as how much faster iWS is than Stronghold. Table 3: SPICE Performance for Java Servlets and C CGI Programs (4 CPUs)
Figure 5: iWS and Stronghold Java Servlet and C CGI SPICE Request Rates (4 CPUs) (larger numbers are better)
Figure 6: iWS and Stronghold Java Servlet and C CGI
SPICE Latencies (4 CPUs)
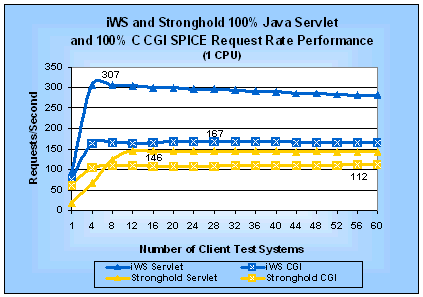
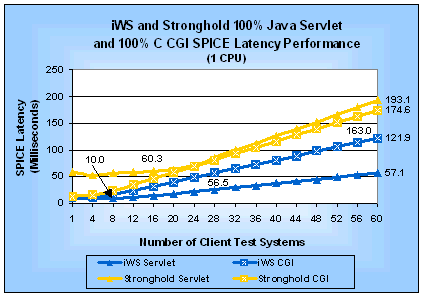
The information in Table 3 is useful for comparing the performance of both Web servers against each other and for comparing the performance of both SPIs on one Web server. We can see that on iWS the SPICE Java servlet is 2.2 times faster than SPICE CGI program. However, for Stronghold the SPICE Java servlet has a 3% lower request rate than the SPICE CGI program while the Java servlet is 19% slower based on the SPICE latency. If you look at the SPICE latency curves in Figure 6, you will see that the difference between the Java servlet and the CGI program increases substantially for iWS after the peak request rate. By looking at the differences in SPICE latency as load increases, you can see how much longer a Java servlet can run than a CGI program and still be more responsive to a user. For Stronghold, however, the speed benefits go to CGI programs. Uniprocessor ResultsFigures 7 and 8 show the SPICE request rate and SPICE latency performance we measured on a uniprocessor server for tests using 100% Java servlet and 100% CGI requests. Table 4 summarizes the corresponding peak performance measurements as well as how much faster iWS is than Stronghold. Table 4: SPICE Performance for Java Servlets and C CGI Programs (1 CPU)
Figure 7: iWS and Stronghold Java Servlet and C CGI SPICE Request Rates (1 CPU) (larger numbers are better)
Figure 8: iWS and Stronghold Java Servlet and C CGI
SPICE Latencies (1 CPU)
The information in Table 4 shows that on a uniprocessor server the iWS SPICE Java servlet can handle 1.8 times more requests per second than the SPICE CGI program. Similarly, for Stronghold the SPICE Java servlet request rate is 1.3 times faster than its SPICE CGI program. SPICE EfficiencyAnother way to compare Java servlets and CGI programs is to look at their SPICE efficiency. Tables 5 and 6 show the SPICE efficiency at peak performance for iWS and Stronghold, respectively. Remember that SPICE latency efficiency is a ratio of the latency for a static request over the latency for a request using a particular SPI on the same Web server. You must be careful not to compare SPICE latency efficiency between two Web servers without the context of the measured SPICE request rate. Otherwise, you may come to the wrong conclusion. Take Stronghold's CGI SPICE latency efficiency as an example. It is higher than the iWS SPICE latency efficiency. Does that mean the same CGI program will support a larger number of requests on Stronghold than on iWS? No. The SPICE request rates given in Figure 7 show that using the same CGI program iWS outperforms Stronghold by over 43% at peak performance for each. Let's compare the SPICE latency efficiencies of each Web server individually. For iWS, it is easy to see that a Java servlet will put significantly less load on a server than a CGI program. For Stronghold the situation is reversed; a CGI program will put less load on a server than a Java servlet. Table 5: iWS SPICE Efficiency at Peak Performance
Table 6: Stronghold SPICE Efficiency
Conclusions
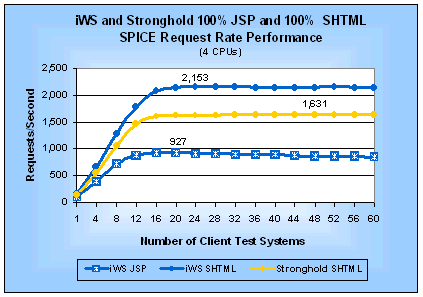
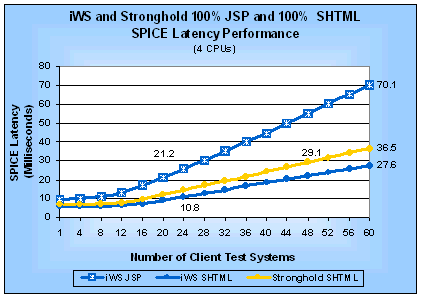
Java Server Pages and SHTML TestsWe have grouped the JSP and SHTML tests together because a Web server must parse the entire file holding each. However, the typical uses for JSP and SHTML are different. JSPs are used to implement both large and small Web applications. SHTML files typically are used to include a common set of HTML in Web pages. While SHTML does have the ability to execute an arbitrary program, that feature is rarely used because of security concerns and because of a performance disadvantage compared to a CGI program (the parsing of the SHTML file is what gives it the disadvantage). Given the different uses for JSP and SHTML, we recommend that you evaluate the test results separately rather than using them to choose which SPI you want to use. The JSP and SHTML tests made 100% of their requests using the respective SPI. We used the same SHTML page for the iWS and Stronghold tests. For the Stronghold JSP test, we looked at using the GNU Java Server Pages software (gnujsp) that is recommended at the Apache JServ Web site. However, the latest version of gnujsp available at the time we did the tests required the Java 1.1 SDK instead of the Java 1.2 SDK that both JServ 1.0 and iWS use. We did not want any of the performance differences we might find to be based on using two different versions of Java for the JSP tests. Therefore, we decided not to test JSPs on Stronghold. Four-Processor ResultsFigures 9 and 10 show the SPICE request rate and SPICE latency performance for the JSP and SHTML tests on a four-processor server. Table 7 shows the corresponding peak performance measurements as well as how much faster iWS is than Stronghold. Table 7: SPICE Performance for JSP and SHTML SPICE Programs (4 CPUs)
Figure 9: iWS and Stronghold JSP and SHTML SPICE
Request Rates (4 CPUs)
Figure 10: iWS and Stronghold JSP and SHTML SPICE
Latencies (4 CPUs)
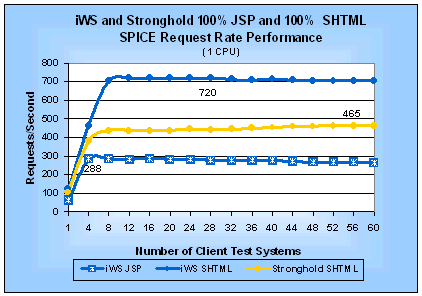
Uniprocessor ResultsFigures 11 and 12 show the SPICE request rate and SPICE latency performance for the JSP and SHTML tests on a uniprocessor server. Figure 11: iWS and Stronghold JSP and SHTML SPICE
Request Rates (1 CPU)
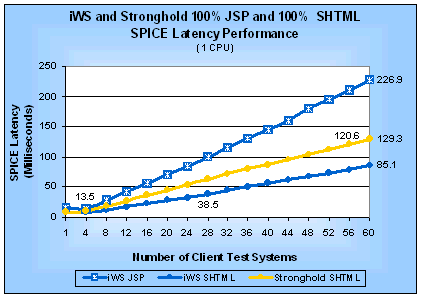
Figure 12: iWS and Stronghold JSP and SHTML SPICE
Latencies (1 CPU)
Table 8 shows the corresponding peak performance measurements as well as how much faster iWS is than Stronghold. Table 8: SPICE Performance for JSP and SHTML SPICE Programs (1 CPU)
SPICE EfficiencyTable 9 shows the JSP and SHTML SPICE efficiency for iWS. Table 10 gives the Stronghold SHTML SPICE efficiency. Table 9: iWS JSP and SHTML SPICE Efficiency
Table 10: Stronghold SHTML SPICE Efficiency
Conclusions
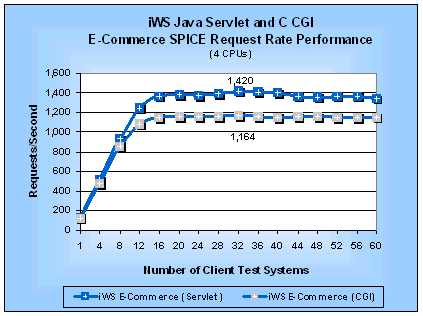
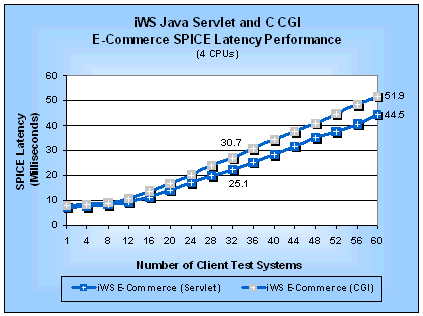
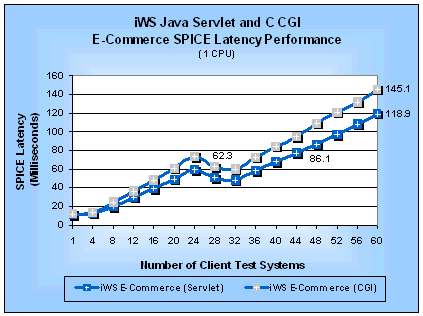
E-Commerce TestsThe WebBench e-commerce tests are a mix of static and dynamic requests using both normal and SSL connections. We substituted our Java servlet and C CGI SPICE programs for the standard WebBench NSAPI and CGI programs in the WebBench e-commerce workload. This substitution lets us evaluate the performance impact of the mix of dynamic requests and SSL connections in the e-commerce tests as compared to the static performance. We could not get a valid run of the e-commerce tests on Stronghold because of an SSL handshaking issue between WebBench 3.0 and Stronghold. C2Net was quite supportive in making suggestions for workarounds but we could not resolve the issue in time for this report. Figures 13 and 14 show the SPICE request rate and SPICE latency performance for the e-commerce tests on a four-processor server. Similarly, Figures 15 and 16 show the e-commerce SPICE request rate and latency, respectively, for a uniprocessor server. Figure 13: iWS Java Servlet and C CGI E-Commerce
SPICE Request Rates (4 CPUs)
Figure 14: iWS Java Servlet and C CGI E-Commerce
SPICE Latencies (4 CPUs)
Figure 15: iWS Java Servlet and C CGI E-Commerce
SPICE Request Rates (1 CPU)
Figure 16: iWS Java Servlet and C CGI E-Commerce
SPICE Latencies (1 CPU)
Table 11 summarizes the SPICE peak performance measurements. We can see that Java servlets on both a uniprocessor and a four-processor server are 1.2 times faster than CGI programs by comparing the SPICE request rates. Table 11: SPICE Performance for E-Commerce Java Servlets and C CGI Programs
Table 9 shows the iWS SPICE efficiencies for the e-commerce tests. Table
9: iWS E-Commerce SPICE Efficiency
Conclusion
Test DetailsSun ServerWe used the same Sun Enterprise 450 server for all of the test reported here. Table 10 shows the system configuration. We used the psradm command to disable three processors for the uniprocessor tests. Table 10: Sun Enterprise 450 Configuration
Solaris 2.6 Operating System, C Compiler, and JavaWe ran all tests using the Solaris 2.6 operating system. We made the following Solaris configuration and tuning changes: 1. We added the following tunes at the end of the /etc/system file: o set rlim_fd_max=8192 o set rlim_fd_cur=8192 o set sq_max_size=0 2. We created a file named S95mctunes and put it in the /etc/rc2.d directory so that our network tunes would be reinstalled whenever we rebooted the system. 3. We applied all of the patches recommended for iWS in its installation instructions. We used the Sun WorkShop Professional C compiler, version 4.2 for compiling all C programs, including recompiling Stronghold. We also applied all of the latest patches for this C compiler. We used the Java 2 SDK, also known as Java 1.2, for all iWS and Stronghold Java requirements. iPlanet Web Server, Enterprise Edition 4.0We have provided the magnus.conf, obj.conf, jvm12.conf, nsfc.conf configuration files we used for tests described in this white paper. We only ran an iWS listening to the SSL port for those tests requiring SSL. We used a 1024-bit certificate from Thawte for the SSL tests. Stronghold 2.4.2 and JServeWe have provided the httpd.conf configuration file we used for Stronghold 2.4.2. Note, we commented all of the SSL-related directives at the end of the file for those tests that did not need SSL. We used a 1024-bit certificate from Thawte for the SSL tests. We were able to improve Stronghold's performance by 43% over the executable version that C2Net ships. To do this, we re-compiled Stronghold 2.4.2 using the following EXTRA_CFLAGS setting, which is in the src/Configuration file: EXTRA_CFLAGS=-DBUFFERED_LOGS -DUSE_PTHREAD_SERIALIZED_ACCEPT Before we could re-compile Stronghold we had to apply a patch to fix a problem with the compilation script. Test LabMindcraft's test lab consists of three types of systems for a total of 60 clients:
All of the clients were connected to an HP ProCurve 4000M switch via a full-duplex 100Base-TX link. The Sun Enterprise 450 was connected to the ProCurve 4000M via two full-duplex Gigabit Ethernet links. We used an independent system to be the WebBench controller. This controller was also connected to the ProCurve 4000M switch. Table 11: Type A Client Configuration
Table 12: Type B Client Configuration
Table 11: Type C Client Configuration
|
||||||||||||||||||||||||||||||||||||||||||||||||||||||||||||||||||||||||||||||||||||||||||||||||||||||||||||||||||||||||||||||||||||||||||||||||||||||||||||||||||||||||||||||||||||||||||||||||||||||||||||||||||||||||||||||||||||||||||||||||||||||||||||||||||||||||||||||||||||||||||||||||
|
|
Changes
NOTICE: The
information in this publication is subject to change without notice. MINDCRAFT, INC. SHALL
NOT BE LIABLE FOR ERRORS OR OMISSIONS CONTAINED HEREIN, NOR FOR
INCIDENTAL OR CONSEQUENTIAL DAMAGES RESULTING FROM THE FURNISHING,
PERFORMANCE, OR USE OF THIS MATERIAL. This
publication does not constitute an endorsement of the product or
products that were tested. This test is not a determination of
product quality or correctness, nor does it ensure compliance with
any federal, state or local requirements. Mindcraft
is a registered trademark of Mindcraft, Inc. The Mindcraft
tests discussed herein were performed without independent
verification by Ziff-Davis and Ziff-Davis makes no representations
or warranties as to the results of the tests. Product and corporate names mentioned herein are trademarks and/or registered trademarks of their respective companies. |
||||||||||||||||||||||||||||||||||||||||||||||||||||||||||||||||||||||||||||||||||||||||||||||||||||||||||||||||||||||||||||||||||||||||||||||||||||||||||||||||||||||||||||||||||||||||||||||||||||||||||||||||||||||||||||||||||||||||||||||||||||||||||||||||||||||||||||||||||||||||||||||||
|
|
|
|
|
|
|
|
|||||||||||||||||||||||||||||||||||||||||||||||||||||||||||||||||||||||||||||||||||||||||||||||||||||||||||||||||||||||||||||||||||||||||||||||||||||||||||||||||||||||||||||||||||||||||||||||||||||||||||||||||||||||||||||||||||||||||||||||||||||||||||||||||||||||||||||||||||||||||||


|
|
Copyright ©
1999-2000. Mindcraft, Inc. All rights reserved. |