 |
Open Benchmark Phases 1 and 2:
|
|||||||||||||||||||||||||||||||||||||||
White Paper Contents
Related Article |
Results for the Second Benchmark and Phases 1 and 2This part of the Open Benchmark white paper discloses the results of the Second Benchmark and discusses the results of Phases 1 and 2 of the Open Benchmark.
Figure 1 shows the results of running the NetBench file-server benchmark for the Second Benchmark and for Phases 1 and 2. You can see that the results are effectively identical even though the Open Benchmark used a different test lab with fewer, much faster client systems.
Figure 1: Second Benchmark vs. Phase
1 and 2 File-Server Performance Figure 2 shows the WebBench benchmark test results for the Second Benchmark and Phases 1 and 2. Mindcraft and Red Hat obtained the same Linux/Apache performance in Phases 1 and 2. The Windows NT Server performance difference between the Second Benchmark and Phase 1 is the result of the differences in the test labs. Web-Server Performance Analysis section below provides an analysis of the odd Linux/Apache performance in the Second Benchmark.
Figure 2: Second Benchmark vs. Phase
1 and 2 Web-Server Performance The Open Benchmark Phases 1 and 2 show that Mindcraft's Second Benchmark of Windows NT Server 4.0 and Linux 2.2.6/Samba 2.0.3/Apache 1.3.6 accurately measured their file- and Web-server performance and was unbiased. Performance AnalysisLooking at NetBench ResultsThe NetBench 5.01 benchmark measures file server performance. Its primary performance metric is throughput in bytes per second. The NetBench documentation defines throughput as "The number of bytes a client transferred to and from the server each second. NetBench measures throughput by dividing the number of bytes moved by the amount of time it took to move them. NetBench reports throughput as bytes per second." We report throughput in megabits per second to make the charts easier to compare to other published NetBench results. Understanding how NetBench 5.01 works will help explain the meaning of the NetBench throughput measurement. NetBench stresses a file server by using a number of test systems to read and write files on a server. A NetBench test suite is made up of a number of mixes. A mix is a particular configuration of NetBench parameters, including the number of test systems used to load the server. Typically, each mix increases the load on a server by increasing the number of test systems involved while keeping the rest of the parameters the same. We modified the standard NetBench NBDM_60.TST test suite to increase the number of test systems to 144 for the Second Benchmark and to 120 for the Open Benchmark. The NetBench Test Suite Configuration Parameters show you exactly how we configured the test.
File Server Performance AnalysisWith this background, let us analyze what the results in Figure 1 mean. The supporting details for Figure 1 are in the NetBench Configuration and Results part of this white paper. The two major areas to notice in Figure 1 are:
The Windows NT Server 4.0 file-server peak performance shows that Linux/Samba do not take full advantage of the four-processor Dell server. We believe the major reasons for the poor Linux/Samba performance are:
The shapes of the performance curves for both Windows NT Server 4.0 and Linux/Samba indicate that we reached peak performance and went beyond it. Performance for both Windows NT Server 4.0 and Linux/Samba degrades slowly as the load is increased past the peak performance load. So both systems should deliver predictable performance even under overload conditions. Looking at WebBench ResultsIn order to understand what the WebBench measurements mean you need to know how WebBench 2.0 works. It stresses a Web server by using a number of test systems to request URLs. Each WebBench test system, also called client, can be configured to use multiple worker threads (threads for short) to make simultaneous Web server requests. By using multiple threads per test system, it is possible to generate a large enough load on a Web server to stress it to its limit with a reasonable number of test systems. The other factor that will determine how many test systems and how many threads per test system are needed to saturate a server is the performance of each test system. The number of threads needed to obtain the peak server performance depends on the speed of the test systems and the server. It is meaningful to compare the peak server performance measurements from different test beds based on the number of threads, not systems, at each data point. That is why our graphs below show the number of test threads for each data point.
Web-Server Performance AnalysisThe primary WebBench 2.0 metric is the number of HTTP GET requests per second the server can satisfy. In addition, WebBench reports the number of bytes per second a Web server sends to all test systems. We tested both Web servers using the standard WebBench zd_static_v20.tst test suite, modified to increase the number of test threads to 288 (144 system with 2 threads each) for the Second Benchmark and to 240 (120 system with 2 threads each) for Phases 1 and 2. This standard WebBench test suite uses the HTTP 1.0 protocol without keepalives. With this background, let us analyze what the results in Figure 2 mean (the supporting detail data for this chart is in the WebBench Configuration and Results part of this white paper). There are two major areas to look at:
Looking at the WebBench results in Figure 2, notice that the performance curves are shifted to the left for Phases 1 and 2 as compared to the Second Benchmark. That is the effect of using faster clients for the Open Benchmark. Windows NT peak performance is slightly higher in Phase 1 than in the Second Benchmark because we did not have enough clients to drive the server to 100% CPU utilization. The Linux/Apache performance in Phases 1 and 2 are essentially identical. However, the Linux/Apache performance in the second benchmark exhibited a performance collapse at 32 threads. Why did this happen since Mindcraft used the same Linux and Apache software versions and configurations in the Second Benchmark and in Phase 1? We used the Linux top command to look at the wait channel before and during the performance collapse. It showed that prior to the collapse Apache was waiting in do_select while after the collapse it was waiting in either wait_for_ or tcp_recvm. There have been several reported problems similar to the performance collapse we found (karthik, van Riel, Arcangeli, Ezlot, Schmidt, and see Kegel for more). This leads us to conclude that there was an interaction between a Linux bug and the test bed we used for the Second Benchmark that caused the performance collapse shown in Figure 2. We verified that the problem was related to Apache by restarting it for the 96-client mix (192 threads). As you can see in Figure 2, performance recovered briefly before collapsing again. Products TestedServer SystemWe used the same Dell PowerEdge 6300/400 for the Second Benchmark and the Open Benchmark. Table 1 shows the system configuration. Table 1: Dell PowerEdge 6300/400 Configuration
Windows NT Server and Linux were each on their own identical disks. We swapped OS disks to change operating systems. The RAID was reformatted each time the operating system was changed. Software Products and TuningWindows NT Server 4.0 File-Server ConfigurationWe tested using Windows NT Server 4.0 Enterprise Edition with Service Pack 4 installed. We made the following configuration and tuning changes:
Windows NT Server 4.0 Web-Server Configuration
Linux 2.2.6 ConfigurationIn Phase 1, we tested using Red Hat Linux 5.2 upgraded to the Linux 2.2.6 kernel following Red Hat's instructions (http://www.redhat.com/support/docs/rhl/kernel-2.2/kernel2.2-upgrade.html). We made the following configuration and tuning changes:
We have included a separate Web page with all of the Linux configuration files that Mindcraft and Red Hat used. See it for Red Hat's Phase 2 Linux tuning. Samba 2.0.3 ConfigurationMindcraft used the pre-compiled version of Samba 2.0.3 in Phase 1. In addition, we:
We have included a separate Web page with the Samba configuration file we used. See it for Red Hat's Phase 2 Samba tuning. Apache 1.3.6 Configuration
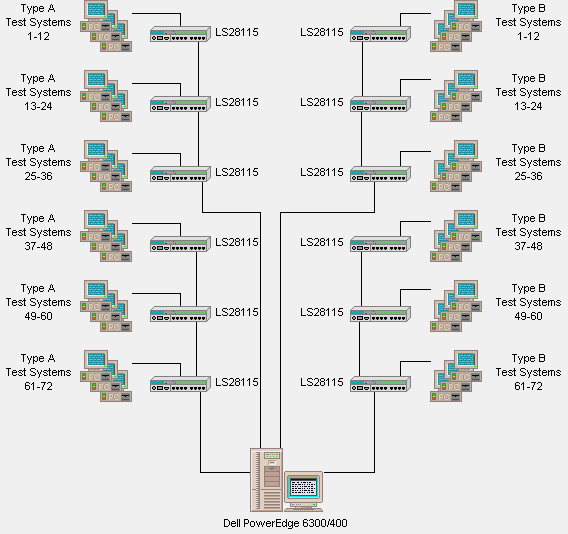
We have included a separate Web page with the Apache configuration files we used. See it for Red Hat's Phase 2 Apache tuning. The Test LabFigure 3 shows the test lab at Microsoft we used for the Second Benchmark. There were 144 test systems in the lab made up of two types. Table 2 and Table 3 show the system configurations. We used 72 Type A systems and 72 Type B systems. Table 2: Type A Test Systems Configuration
Table 3: Type B Test Systems Configuration
|
|||||||||||||||||||||||||||||||||||||||
|
Figure 3: Second Benchmark Test Lab
|
||||||||||||||||||||||||||||||||||||||||
|
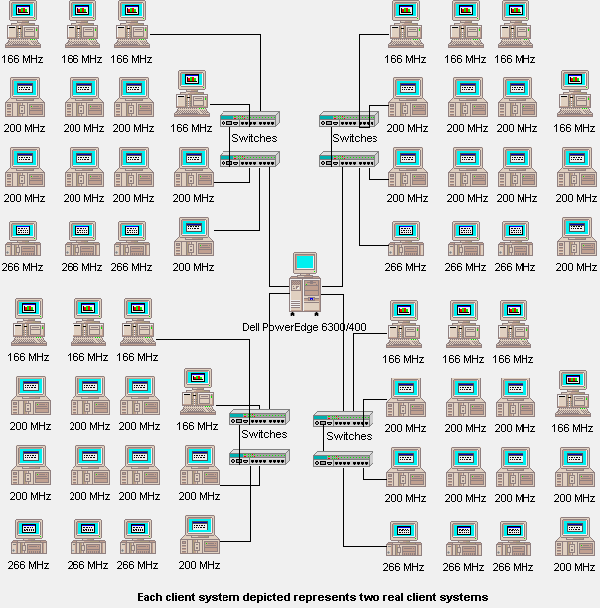
Figure 4 shows the test lab used for the Open Benchmark at ZD Labs. In order to simplify the diagram, each client test system depicted represents two identical systems. |
||||||||||||||||||||||||||||||||||||||||
|
Figure 4: Open Benchmark Lab
|
||||||||||||||||||||||||||||||||||||||||
|
NOTICE: The information in this publication is subject to change without notice. MINDCRAFT, INC. SHALL NOT BE LIABLE FOR ERRORS OR OMISSIONS CONTAINED HEREIN, NOR FOR INCIDENTAL OR CONSEQUENTIAL DAMAGES RESULTING FROM THE FURNISHING, PERFORMANCE, OR USE OF THIS MATERIAL. This publication does not constitute an endorsement of the product or products that were tested. This test is not a determination of product quality or correctness, nor does it ensure compliance with any federal, state or local requirements. Product and corporate names mentioned herein are trademarks and/or registered trademarks of their respective companies. |
||||||||||||||||||||||||||||||||||||||||


